Drawing a Results Table
|
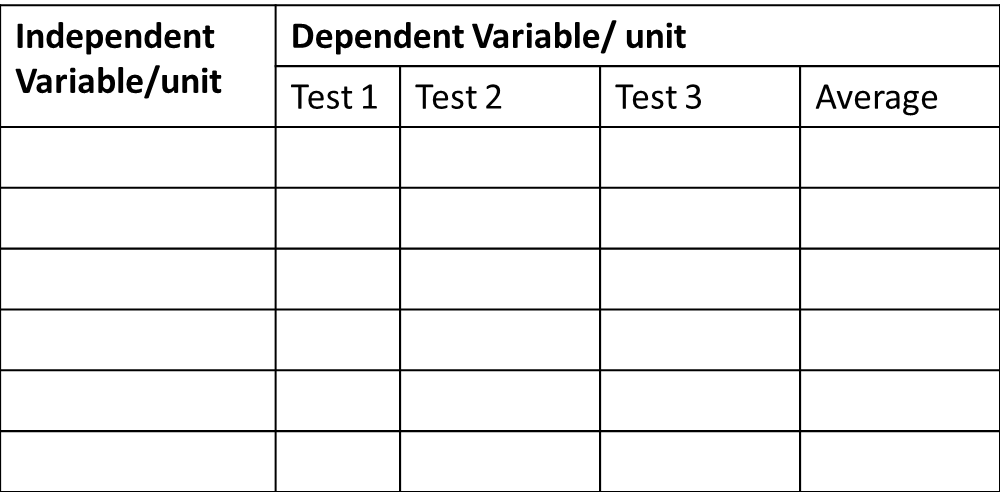
The independent variable always goes in the left-hand column.
The dependent variable always goes in the right-hand column. Each variable has an appropriate unit. |
|
The table has space for the student to take repeats and to calculate an average.
High flyers could put the accuracy of their measurements after the unit. eg. to the nearest cm. |
