Experiment to Investigate Factors that Affect Cooling
VolumeMethod
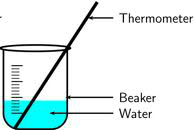
1) We filled four identical 250ml beakers with different volumes of water at 60 degrees C from a water bath. These volumes were 50ml, 100ml, 150ml and 200ml. 2) Using a thermometer and a stopwatch we recorded the temperature ever 30s for 15 minutes and plotted a graph of our results. 3) We calculated the rate of cooling by finding the gradient of the graph. |
Surface AreaMethod
1) We put 50ml of water in four beakers of different surface areas. 2) Using a thermometer and a stopwatch we recorded the temperature ever 30s for 15 minutes and plotted a graph of our results. 3) We calculated the rate of cooling by finding the gradient of the graph. |
Starting TemperatureMethod
1) We filled four identical 250ml beakers with 200ml of water at 60, 50, 40 and 30 degrees C. 2) Using a thermometer and a stopwatch we recorded the temperature ever 30s for 15 minutes and plotted a graph of our results. 3) We calculated the rate of cooling by finding the gradient of the graph. |
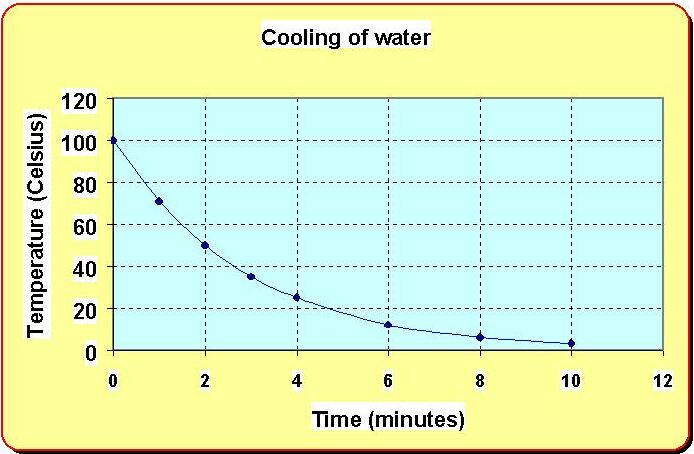
Results!Our results showed that:
As the Volume of the water increased, the rate of cooling decreased. As the Surface Area increased, the rate of cooling increased. As the Starting Temperature increased the rate of cooling increased. All of the graphs were exponential curves so the rate of cooling also depended on the temperature difference between the beaker and the room. The rate of cooling slowed down as the temperature difference decreased. |
Can you use these results to explain why elephants have large ears but polar bears have small ones?
